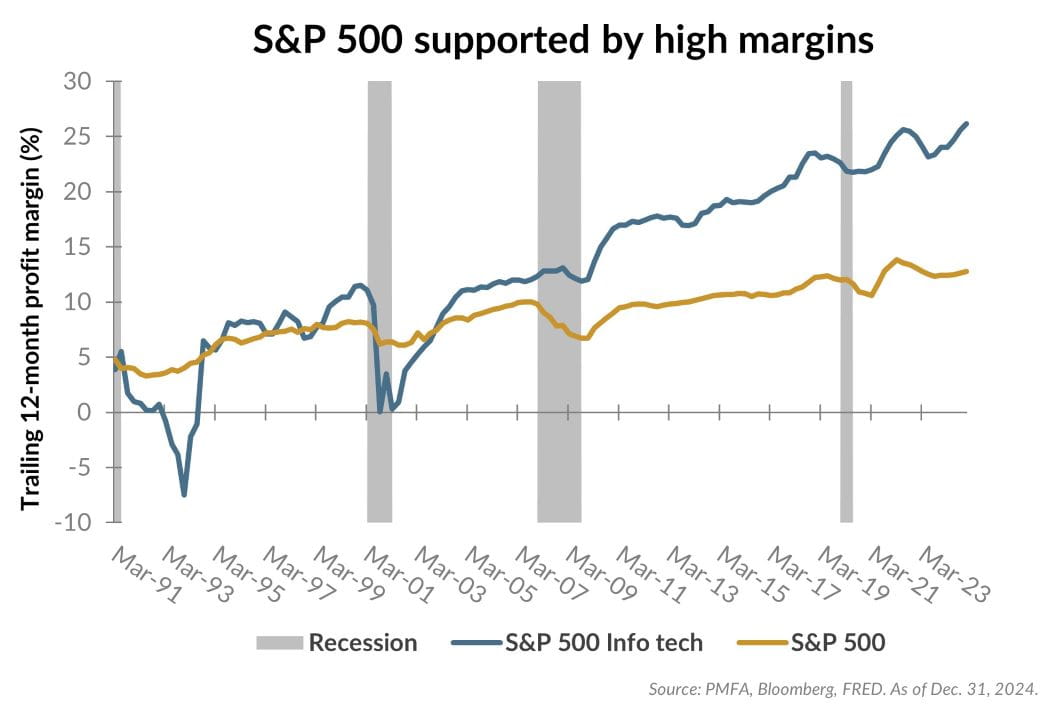
As shown in the chart above, the profitability profile of the S&P 500 index today has changed considerably over the past 30 years. While not illustrated, that would also be true over the much longer term as well. In fact, the profit margin of the S&P 500 stands at 12.7% today. That means that for every dollar of revenue earned in aggregate by the S&P 500 companies, nearly 13 cents flows to the bottom line. While not universally true among its constituents, the profit margin for the S&P 500 is near its highest point in over three decades.
Much of this improved profitability has come from the technology sector, where margins have reached 26% — double those of the S&P 500 index. In conjunction with this rise in profit margins, the tech sector has grown steadily relative to the U.S. stock market, now representing roughly a third of the S&P 500 index.
Companies with higher margins and stronger cash flows can invest more aggressively in their business to generate future growth in profits. In addition, higher profit margins contribute to greater financial stability, as they provide the capacity to cut prices while remaining highly profitable. These factors also contribute to their stocks often carrying higher valuations than lower-margin companies.
What’s the bottom line? Index-level valuations today are high relative to history. Part of that can be explained by underlying fundamentals. Profitability is one key support.
Past performance does not guarantee future results. All investments include risk and have the potential for loss as well as gain.
Data sources for peer group comparisons, returns, and standard statistical data are provided by the sources referenced and are based on data obtained from recognized statistical services or other sources believed to be reliable. However, some or all of the information has not been verified prior to the analysis, and we do not make any representations as to its accuracy or completeness. Any analysis nonfactual in nature constitutes only current opinions, which are subject to change. Benchmarks or indices are included for information purposes only to reflect the current market environment; no index is a directly tradable investment. There may be instances when consultant opinions regarding any fundamental or quantitative analysis may not agree.
Plante Moran Financial Advisors (PMFA) publishes this update to convey general information about market conditions and not for the purpose of providing investment advice. Investment in any of the companies or sectors mentioned herein may not be appropriate for you. You should consult a representative from PMFA for investment advice regarding your own situation.


