By virtually any measure, the U.S. stock market has had a rocky start to the year. After moving gradually higher through mid-February, the S&P 500 reversed course and recently entered “correction” territory — defined as a 10% pullback from its most recent peak. Additional selling pressure was evident today in the wake of the recent, and much more comprehensive, tariff announcements.
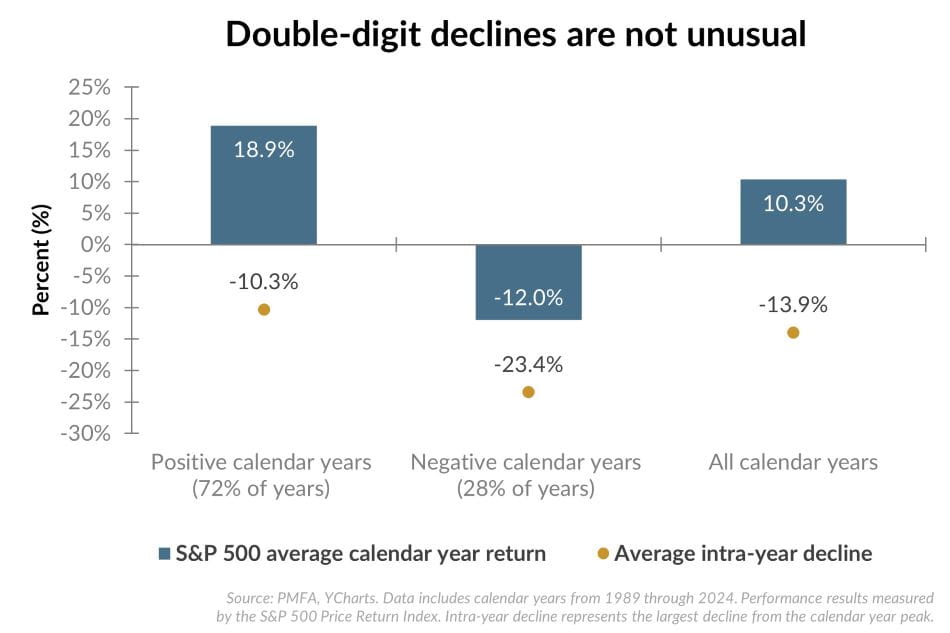
Periods of volatility, especially downturns, can be disconcerting for investors. However, the chart above offers valuable historical perspective on such periods.
- First, equity markets experience a drawdown at some point every year — even in the context of a bull market — though the shape and severity of each decline differs. As noted above, even in positive years for stocks, the average intrayear drawdown was about 10%.
- Second, in spite of those dips, calendar year returns are still positive nearly 75% of the time, rewarding investors who stayed the course.
- Third, equities often bounce back quickly after bottoming. In those calendar years that posted negative returns, the year-end decline was, on average, about half (-12%) of the peak to trough decline (-23.4%). While timing the bottom is an impossible task, rebalancing a portfolio (buying what’s down) after prices correct has proven beneficial over time.
The bottom line is that temporary declines within a given calendar year are the rule, not the exception. Long-term investors have historically been rewarded for investing through volatile periods, as the economic or policy landscape shifts, companies innovate, and new opportunities arise.
Past performance does not guarantee future results. All investments include risk and have the potential for loss as well as gain.
Data sources for peer group comparisons, returns, and standard statistical data are provided by the sources referenced and are based on data obtained from recognized statistical services or other sources believed to be reliable. However, some or all of the information has not been verified prior to the analysis, and we do not make any representations as to its accuracy or completeness. Any analysis nonfactual in nature constitutes only current opinions, which are subject to change. Benchmarks or indices are included for information purposes only to reflect the current market environment; no index is a directly tradable investment. There may be instances when consultant opinions regarding any fundamental or quantitative analysis may not agree.
Plante Moran Financial Advisors (PMFA) publishes this update to convey general information about market conditions and not for the purpose of providing investment advice. Investment in any of the companies or sectors mentioned herein may not be appropriate for you. You should consult a representative from PMFA for investment advice regarding your own situation.
© 2025 YCharts, Inc. All rights reserved, The information contained herein: (1) is proprietary to YCharts, Inc. and/or its content providers; (2) may not be copied, reproduced, retransmitted, or distributed; and (3) is provided “AS IS” with all faults and is not warranted to be accurate, complete, or timely. YCHARTS, INC. AND ITS CONTENT PROVIDERS EXPRESSLY DISCLAIM, TO THE FULLEST EXTENT PERMITTED BY APPLICABLE LAW, ANY WARRANTY OF ANY KIND, WHETHER EXPRESS OR IMPLIED, INCLUDING WARRANTIES OF MERCHANTABILITY, FITNESS FOR A PARTICULAR PURPOSE, ACCURACY OF INFORMATIONAL CONTENT, OR ANY IMPLIED WARRANTIES ARISING OUT OF COURSE OF DEALING OR COURSE OF PERFORMANCE. Neither YCharts, Inc. nor its content providers are responsible for any damages or losses arising from any use of this information. Past performance is no guarantee of future results.


