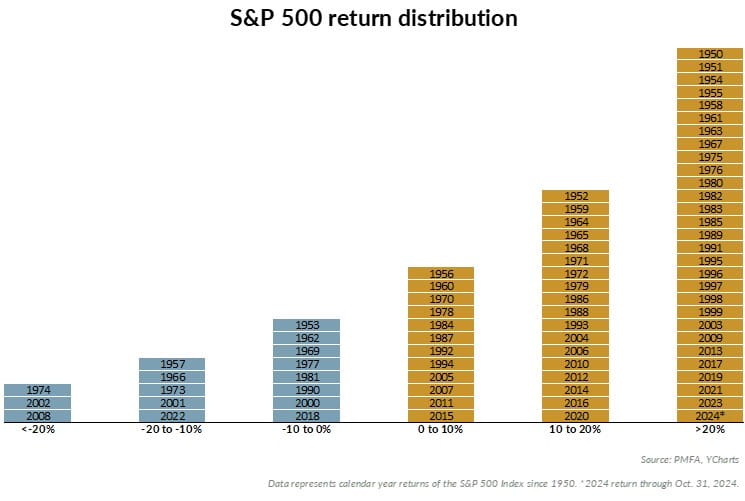
As we head into the final month of 2024, it’s been another strong year for equity market performance, with the S&P 500 returning more than 25% year to date through November 30. But how does that stack up to history?
The chart above illustrates the distribution of S&P 500 calendar year returns since 1950. As depicted, the index has posted a negative return in only 16 of the past 75 years, or about 20% of the time over that period. Nearly 80% of the time, calendar year performance has been positive. Moreover, in 29 of those 75 years (nearly 40% of the time), the index return topped 20% — well above the long-term average of 8-10%. That’s also been true in three of the past four years in what’s been a robust run for equity markets coming out of the 2020 recession.
What does this mean for investors? While the chart illustrates that negative performance in a given year is relatively common (occurring in about one of every five years), markets have tended to experience unusually strong years (20+%) much more frequently than negative ones. Drawdowns have always been part and parcel of investing in equities, and investors shouldn’t be surprised when markets turn volatile. Such periods can create opportunities for investors to buy the dips or opportunistically rebalance their portfolios. And notably, while those years with negative performance may be challenging to weather, they’re often followed by a strong resurgence in stock prices, allowing those who have remained invested to reap the benefit. Over time, those positive years will easily outweigh periods of weakness, both in their frequency and their positive impact on long-term performance.
Past performance does not guarantee future results. All investments include risk and have the potential for loss as well as gain.
Data sources for peer group comparisons, returns, and standard statistical data are provided by the sources referenced and are based on data obtained from recognized statistical services or other sources believed to be reliable. However, some or all of the information has not been verified prior to the analysis, and we do not make any representations as to its accuracy or completeness. Any analysis nonfactual in nature constitutes only current opinions, which are subject to change. Benchmarks or indices are included for information purposes only to reflect the current market environment; no index is a directly tradable investment. There may be instances when consultant opinions regarding any fundamental or quantitative analysis may not agree.
Plante Moran Financial Advisors (PMFA) publishes this update to convey general information about market conditions and not for the purpose of providing investment advice. Investment in any of the companies or sectors mentioned herein may not be appropriate for you. You should consult a representative from PMFA for investment advice regarding your own situation.
© 2024 YCharts, Inc. All rights reserved, The information contained herein: (1) is proprietary to YCharts, Inc. and/or its content providers; (2) may not be copied, reproduced, retransmitted, or distributed; and (3) is provided “AS IS” with all faults and is not warranted to be accurate, complete, or timely. YCHARTS, INC. AND ITS CONTENT PROVIDERS EXPRESSLY DISCLAIM, TO THE FULLEST EXTENT PERMITTED BY APPLICABLE LAW, ANY WARRANTY OF ANY KIND, WHETHER EXPRESS OR IMPLIED, INCLUDING WARRANTIES OF MERCHANTABILITY, FITNESS FOR A PARTICULAR PURPOSE, ACCURACY OF INFORMATIONAL CONTENT, OR ANY IMPLIED WARRANTIES ARISING OUT OF COURSE OF DEALING OR COURSE OF PERFORMANCE. Neither YCharts, Inc. nor its content providers are responsible for any damages or losses arising from any use of this information. Past performance is no guarantee of future results.


