Volatility is an unavoidable byproduct of investing in equities, but the sources of market volatility are varied and many. Geopolitical risks, macroeconomic developments, the ebb and flow of the corporate earnings cycle, and changes in monetary or fiscal policy are just some of the potential catalysts that can swing to the benefit or detriment of equity investors. At any given time, multiple sources of risk can coalesce, leading to a potentially more pronounced or prolonged bout of volatility.
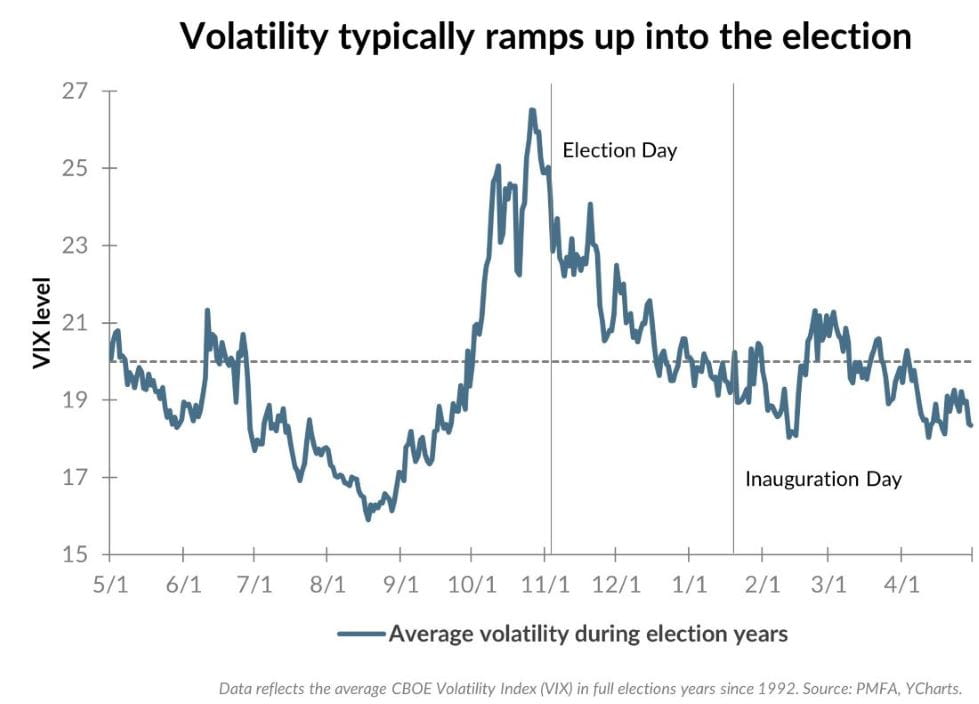
The chart above illustrates the average historical path of stock market volatility during presidential election years since 1992 using the CBOE Volatility Index (VIX). The VIX tends to remain in a lower volatility range (below 20) through much of the year, with a more pronounced ramp-up in volatility in the months leading up to Election Day, before subsiding thereafter. This is largely attributable to investor uncertainty related to the election outcome and the resulting direction of various policies that could result. The VIX has peaked around 27, on average, in the past eight election years, typically occurring over a handful of days prior to the election. That level pales in comparison to the type of market volatility that accompanies recessions and bear markets but can create a bumpier ride for investors during the period leading up to Election Day.
What’s the bottom line? An uptick in volatility leading up to the election would come as no surprise given the experience in recent decades. The post-election story has generally been notably different, as volatility has generally receded as the market shakes off election-related jitters.
Past performance does not guarantee future results. All investments include risk and have the potential for loss as well as gain.
Data sources for peer group comparisons, returns, and standard statistical data are provided by the sources referenced and are based on data obtained from recognized statistical services or other sources believed to be reliable. However, some or all of the information has not been verified prior to the analysis, and we do not make any representations as to its accuracy or completeness. Any analysis nonfactual in nature constitutes only current opinions, which are subject to change. Benchmarks or indices are included for information purposes only to reflect the current market environment; no index is a directly tradable investment. There may be instances when consultant opinions regarding any fundamental or quantitative analysis may not agree.
Plante Moran Financial Advisors (PMFA) publishes this update to convey general information about market conditions and not for the purpose of providing investment advice. Investment in any of the companies or sectors mentioned herein may not be appropriate for you. You should consult a representative from PMFA for investment advice regarding your own situation.
© 2024 YCharts, Inc. All rights reserved, The information contained herein: (1) is proprietary to YCharts, Inc. and/or its content providers; (2) may not be copied, reproduced, retransmitted, or distributed; and (3) is provided “AS IS” with all faults and is not warranted to be accurate, complete, or timely. YCHARTS, INC. AND ITS CONTENT PROVIDERS EXPRESSLY DISCLAIM, TO THE FULLEST EXTENT PERMITTED BY APPLICABLE LAW, ANY WARRANTY OF ANY KIND, WHETHER EXPRESS OR IMPLIED, INCLUDING WARRANTIES OF MERCHANTABILITY, FITNESS FOR A PARTICULAR PURPOSE, ACCURACY OF INFORMATIONAL CONTENT, OR ANY IMPLIED WARRANTIES ARISING OUT OF COURSE OF DEALING OR COURSE OF PERFORMANCE. Neither YCharts, Inc. nor its content providers are responsible for any damages or losses arising from any use of this information. Past performance is no guarantee of future results.


