
What’s behind the surge in market volatility?
The United States has entered a state of transition — one that’s playing out in policy but is now being manifested more clearly in the capital markets. The risk-on mood that provided a boost to stocks to close out last year is common following U.S. presidential elections. Over the past month or so, investor focus has shifted from the pro-growth potential of proposed tax cuts and deregulation to both the risk and range of unknowns associated with tariffs and realignment in America’s geopolitical positioning.
So why has sentiment recently shifted?
First and foremost is an increase in the pace and significance of policy change and uncertainty around potential outcomes. Trade policy in particular, along with the Trump administration’s notable shift in tone on the Russia-Ukraine war, has raised questions about the near-term economic outlook and the direction of trade and geopolitical relations.
As we discussed in a prior piece, the current policy proposals introduce a range of potential effects on the economy and capital markets. Some may ultimately be supportive of economic growth, while others are likely to have a dampening effect. For instance, the near-term impact of tariffs is expected to be inflationary, while slowing growth. The quantitative effect is impossible to accurately gauge and will hinge on a variety of factors (most notably the magnitude, breadth, and duration of tariffs) that remain in flux.
The policy response of trading partners and the reactions of both businesses and consumers to higher prices will also play material roles in determining the impact of these tariffs. As a result, questions persist around where policy might land or how those impacted will respond. To what degree will businesses or consumers absorb the additional costs? That remains to be seen. For additional context around the trade picture, we’d point you to two pieces we recently released covering the origins of U.S. imports and the relative impact on the United States versus Canada and Mexico.
The recent focus of investors has surrounded the adverse effects of tariffs; at levels proposed, many forecasts have estimated a 0.5% reduction to U.S. GDP over the next 12 months. While these estimates indicate that tariffs alone are unlikely to cause recession, the underlying assumptions remain a moving target, limiting the confidence level and shelf life associated with forecasts. Further, they may not fully reflect the ripple effects created by shifting sentiment, changing business dynamics, or resulting consumer spending behavior.
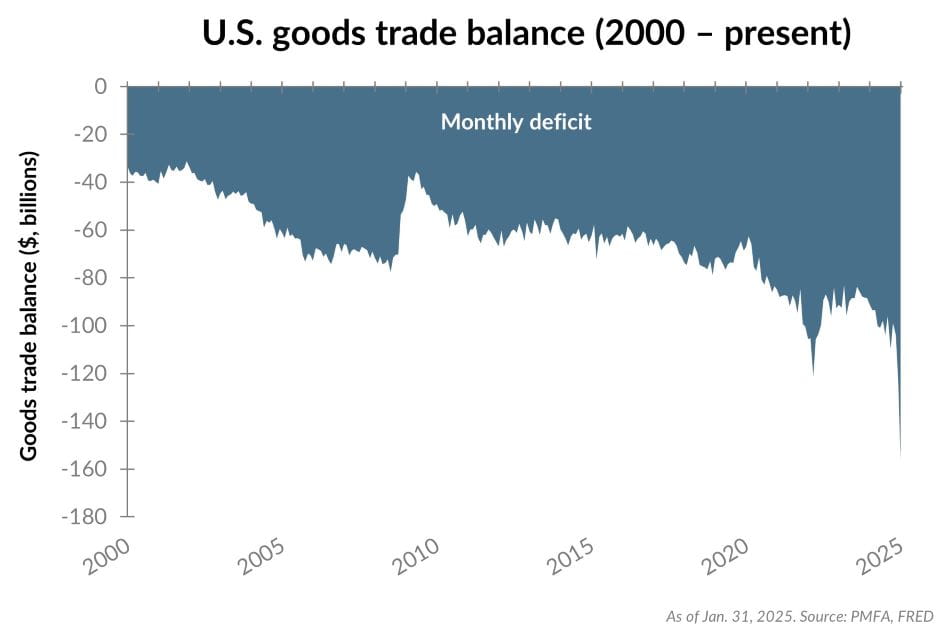
Amid recent policy changes, we’ve already seen softer readings across various economic data points. With a very cold January (the coldest since 1988), retail sales were a bit soft, raising doubts about the strength of the consumer. Additionally, the labor market has slowed a bit, with 151,000 jobs added in February and the unemployment rate ticking modestly higher to 4.1%. (Further, the announcement of job cuts across multiple federal agencies has been an important development, although a temporary one that shouldn’t overwhelm private sector hiring over an extended period. The full extent of those cuts is still filtering into the data, creating a moderate drag on job creation in the near term.) More recently, newly released data indicated that the trade deficit widened significantly in January, as businesses accelerated imports to front run tariffs. That said, a meaningful portion of the increased gap was attributable to a surge in precious metal imports that won’t affect GDP.
Add it all up, and Q1 growth is likely to be slower than its pace over the second half of last year. That would also follow the trend of recent years, in which the economy has come out of the gates slowly in Q1, only to gather momentum over the remainder of the year.
Putting recent volatility in perspective
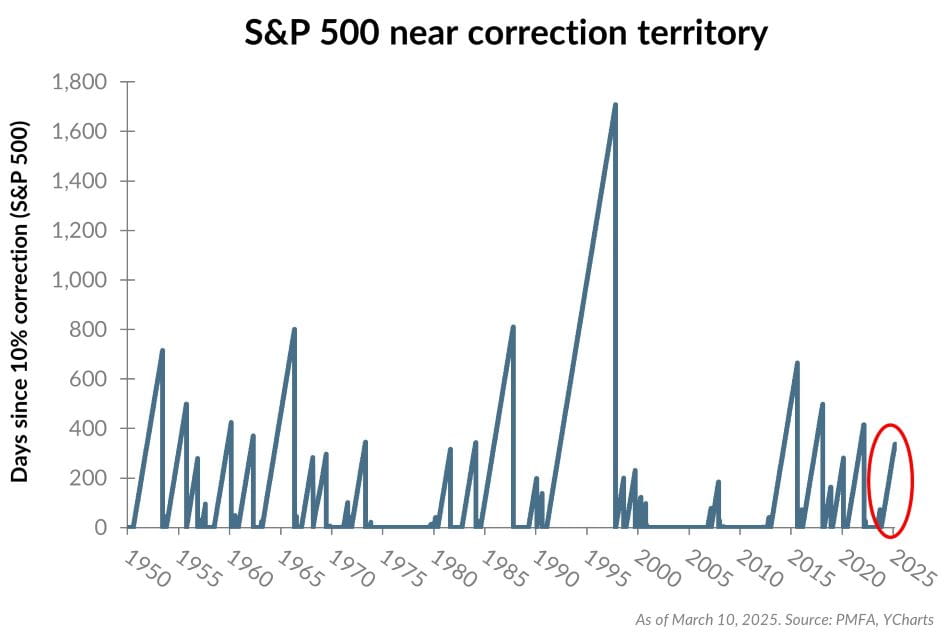
Monday’s volatile markets pulled the S&P 500 further into negative territory (-4.3%) on a year-to-date basis, although it remains solidly positive over the past 12 months. The index is now at the cusp of a 10% correction from its mid-February peak, a decline threshold that’s not uncommon across market cycles even within the context of a bull market. The current run of over 330 trading days without a 10% correction since October 2023 has been atypically long, though not without precedent, as illustrated below.
Periodic bouts of market volatility aren’t a matter of if, but when. Neither the specific catalyst(s) behind a surge in volatility, nor its timing, can be predicted. After two consecutive calendar years of robust market gains, a pullback at some point was inevitable. Equities were choppy on Tuesday morning, before slipping more deeply into the red after the announcement of increased tariffs on Canadian steel and aluminum from 25 to 50% effective March 12. (Notably, that additional 25% surcharge appears to have been walked back late this afternoon, although the previously announced 25% tariff appears to remain in place.) With the index already near a 10% correction coming into the day, it’s a threshold that may have been breached by the time you read this.
Further, we’d reiterate that the stock market has experienced a midyear correction of 10% or more in about half of all calendar years since 1990. Over that same time period, the S&P 500 has provided a positive return about 75% of the time. In short, intrayear volatility is much more common than negative years in the stock market. It’s not unusual for periods of downside volatility to be followed by a reversal that lifts the market back into positive territory in a matter of months, particularly in the absence of a recession.
Conversely, bonds have performed well year to date, serving as an effective diversifier to blunt the impact of equity market volatility for balanced investors. The Bloomberg U.S. Aggregate has returned 2.6% year to date through Monday, while its tax-exempt counterparts have returned about 1.5%. International markets have bucked expectations, advancing despite the flow of negative news. Investors have unambiguously benefited from their diversified holdings beyond U.S. large cap stocks.
What should investors do?
During periods of elevated uncertainty, there’s often an urge to “do something.” As our clients know, we aren’t advocates of market timing — a long-standing philosophical underpinning to our portfolio strategy borne out by ample academic studies and practical experiences over time. Stated simply, market timing doesn’t work, and various studies on investor behavior and outcomes over many decades bear that out.
Setting aside a market-timing strategy, investors may find it beneficial to reasonably consider their current positioning. Those steps should be viewed through the lens of long-term goals and objectives and not driven by speculative “what ifs” that often come to the forefront during periods of uncertainty.
As a starting point, investors are best suited to evaluate and reaffirm their plan as outlined in their investment policy statement. We recommend that investors ensure their portfolio:
- Is broadly diversified.
- Holds sufficient cash and other relatively stable, liquid assets to fund near-term spending, capital commitments, and other cash needs.
- Is well aligned with one’s risk tolerance.
- Is appropriately focused on the investor’s actual investment time horizon, which is likely measured not in weeks or months, but in years or decades.
Secondly, investors shouldn’t focus solely on “what could go wrong.” Inherently, risks are almost always easy to see. Conversely, investors shouldn’t lose sight of what could go right. Over the long term — and in three of every four calendar years over many decades — stocks have provided positive returns. Market volatility can’t be avoided, and corrections aren’t unusual. While their duration and magnitude vary over time, the long-term positive trend for stocks remains intact, rewarding investors for taking risk.
At the same time, it’s important to recognize the importance and benefits of diversification. Given the strong rally in equity markets that have lifted portfolio values in recent years and higher fixed income yields, investors may be able to successfully reach their goals with less risk today than when their investment policy was initially formalized. Bonds are well positioned to contribute more to portfolio returns than was the case from 2009–2022, while providing income and a buffer against equity market volatility. Exposure to broadly diversified equities beyond the large growth-oriented blue chips also adds diversification benefits; alternative investments can as well for investors that are able to access quality strategies and are comfortable with their relative complexity, tax considerations, and liquidity constraints. Reconsidering — and reaffirming or adjusting — one’s asset allocation with a long-term view in mind can provide reassurance and a sense of confidence despite near-term macro uncertainty.
Final thoughts
Over time, the pendulum of market sentiment swings from positive to negative and back again, many times within any given cycle. As uncertainty waxes and wanes, investors take notice. More recently, sentiment has swung back in a negative direction, as the uncertainty around policy has clouded the near-term outlook. While we can't say definitively how long that negative sentiment might persist, we know that it will swing back in a positive direction, benefiting investors who have remained invested even through the period of uncertainty.
As always, we’ll continue to monitor developments and market conditions and consider what changes, if any, will be appropriate in portfolio positioning. Please don’t hesitate to reach out to your PMFA relationship manager with any questions or concerns.
Past performance does not guarantee future results. All investments include risk and have the potential for loss as well as gain.
Data sources for peer group comparisons, returns, and standard statistical data are provided by the sources referenced and are based on data obtained from recognized statistical services or other sources believed to be reliable. However, some or all of the information has not been verified prior to the analysis, and we do not make any representations as to its accuracy or completeness. Any analysis nonfactual in nature constitutes only current opinions, which are subject to change. Benchmarks or indices are included for information purposes only to reflect the current market environment; no index is a directly tradable investment. There may be instances when consultant opinions regarding any fundamental or quantitative analysis may not agree.
Plante Moran Financial Advisors (PMFA) publishes this update to convey general information about market conditions and not for the purpose of providing investment advice. Investment in any of the companies or sectors mentioned herein may not be appropriate for you. You should consult a representative from PMFA for investment advice regarding your own situation.
© 2025 YCharts, Inc. All rights reserved, The information contained herein: (1) is proprietary to YCharts, Inc. and/or its content providers; (2) may not be copied, reproduced, retransmitted, or distributed; and (3) is provided “AS IS” with all faults and is not warranted to be accurate, complete, or timely. YCHARTS, INC. AND ITS CONTENT PROVIDERS EXPRESSLY DISCLAIM, TO THE FULLEST EXTENT PERMITTED BY APPLICABLE LAW, ANY WARRANTY OF ANY KIND, WHETHER EXPRESS OR IMPLIED, INCLUDING WARRANTIES OF MERCHANTABILITY, FITNESS FOR A PARTICULAR PURPOSE, ACCURACY OF INFORMATIONAL CONTENT, OR ANY IMPLIED WARRANTIES ARISING OUT OF COURSE OF DEALING OR COURSE OF PERFORMANCE. Neither YCharts, Inc. nor its content providers are responsible for any damages or losses arising from any use of this information. Past performance is no guarantee of future results.


