CMS recently updated the staffing domain in the Five-Star staffing system. Read on to explore the impact of the changes, along with strategies skilled nursing facilities can adopt to stay profitable amid the updated metrics and CMS Minimum Staffing Rule.
In September 2023, CMS announced an update to the staffing domain in the Five-Star system; its goal to transition to the Patient-Driven Payment Model (PDPM) concurrent with the transition to Minimum Data Set (MDS) 3.0. Beginning in April 2024, the staffing measures were frozen for one quarter while data was collected for this transition. On July 31, 2024, CMS began posting nursing home staffing measures based on the new PDPM case-mix adjustment methodology.
As part of the implementation of the new staffing-level case-mix adjustment methodology, CMS revised the staffing rating thresholds with the intent to maintain the same overall distribution of points for affected staffing measures. However, CMS indicated individual provider scores may change due to a few reasons, including:
- The updated staffing-level case-mix adjustment methodology.
- Changes in number of staffing hours reported by facilities from one quarter to the next.
- Other revisions to the staffing turnover methodology, described below.
In addition to implementing the new case-mix adjustment methodology, effective with the July 2024 refresh CMS has modified the number of days during which no work hours are reported for defining staffing turnover from 60 days to 90 days to allow employees who take full parental leave under the Family Medical Leave Act to not be considered for the turnover measures.
The six components to the CMS Five-Star Quality System staffing measure are listed below. While all six components are recalculated quarterly, the turnover measures use a 12-month period rather than a single quarter.
Quarter average:
- Case-mix adjusted RN hours per resident day — 100 points
- Case-mix adjusted total nursing hours per resident day — 100 points
- Case-mix adjusted total nursing weekend hours per resident day — 50 points
Twelve-month period:
- RN turnover — 50 points
- Total nursing turnover — 50 points
- Administrative turnover — 30 points
(Note that six consecutive quarters of Payroll-Based Journal (PBJ) data are required. For the turnover measures, nursing homes that fail to submit or submit erroneous staffing data for one or more of the quarters used in the turnover calculation will receive the lowest possible score for the corresponding measure.)
The cut points for all staffing measures were updated with the July 2024 Care Compare refresh, except for administrator turnover. The new ranges for point values can be found in Table A2 of the Five-Star Quality Rating System: Technical User’s Guide July 2024.
Comparing July 2024 refresh to April 2024 refresh
The April 2024 refresh included resource utilization group case-mix adjusted staffing hours for the third quarter of 2023 and turnover calculations through the fourth quarter of 2023.
The July 2024 refresh includes PDPM case-mix adjusted staffing hours for the first quarter of 2024 and turnover calculations through the first quarter of 2024.
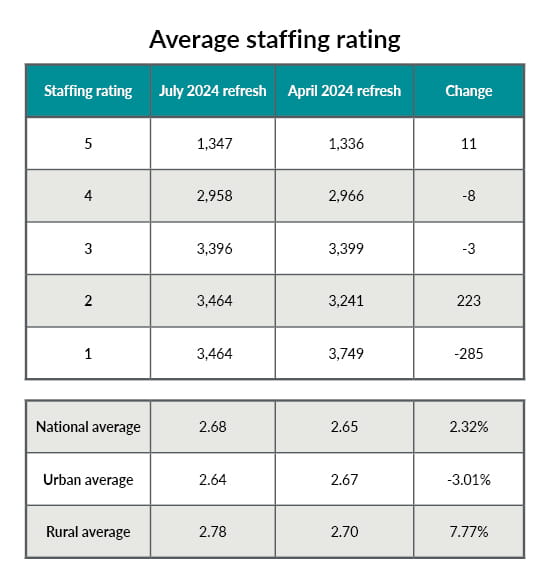
Staffing score distribution
The national nursing staffing rating distribution remained relatively unchanged with a small increase in number of providers shifting from one star to two star.

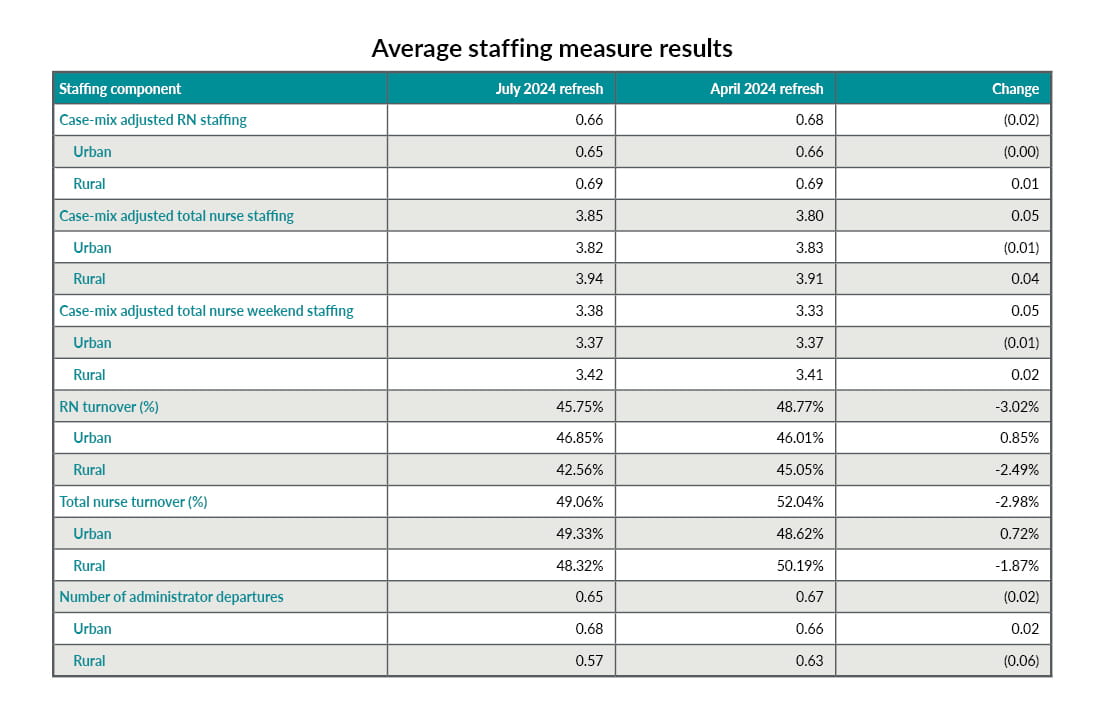
Staffing component scores
The national nursing staffing hours per resident day component scores remained relatively unchanged with the transition to PDPM case-mix adjustments. The national nursing turnover scores dropped around 3% for RN and total nurse turnover. Despite little change in overall nursing hours, the transition to PDPM may have positively impacted nurse retention, leading to a decrease in RN and total nurse turnover rates by around 3%.

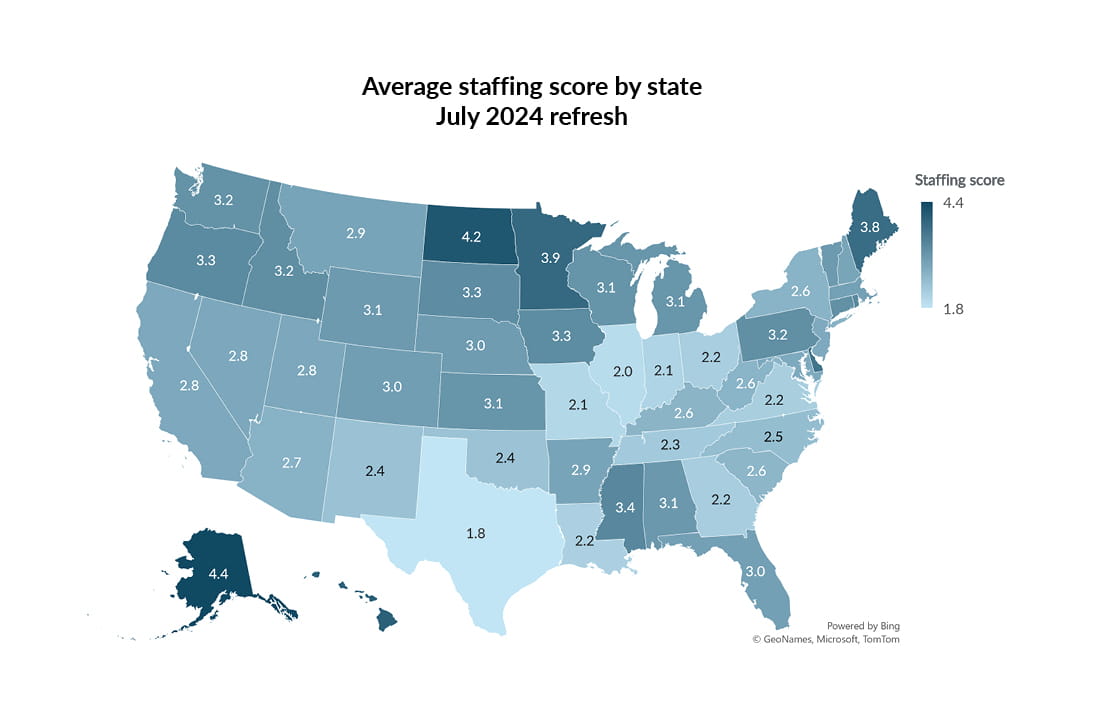
Comparing Five-Star staffing scores to quality scores
The state-average Five-Star staffing score by state varies from 1.8 to 4.4 across the nation.
Keep in mind, we do see providers who forget to submit their PBJ data or have technical issues resulting in incomplete data being submitting that contributes to these fluctuations. Additionally, states with higher Medicaid funding typically have higher staffing levels.

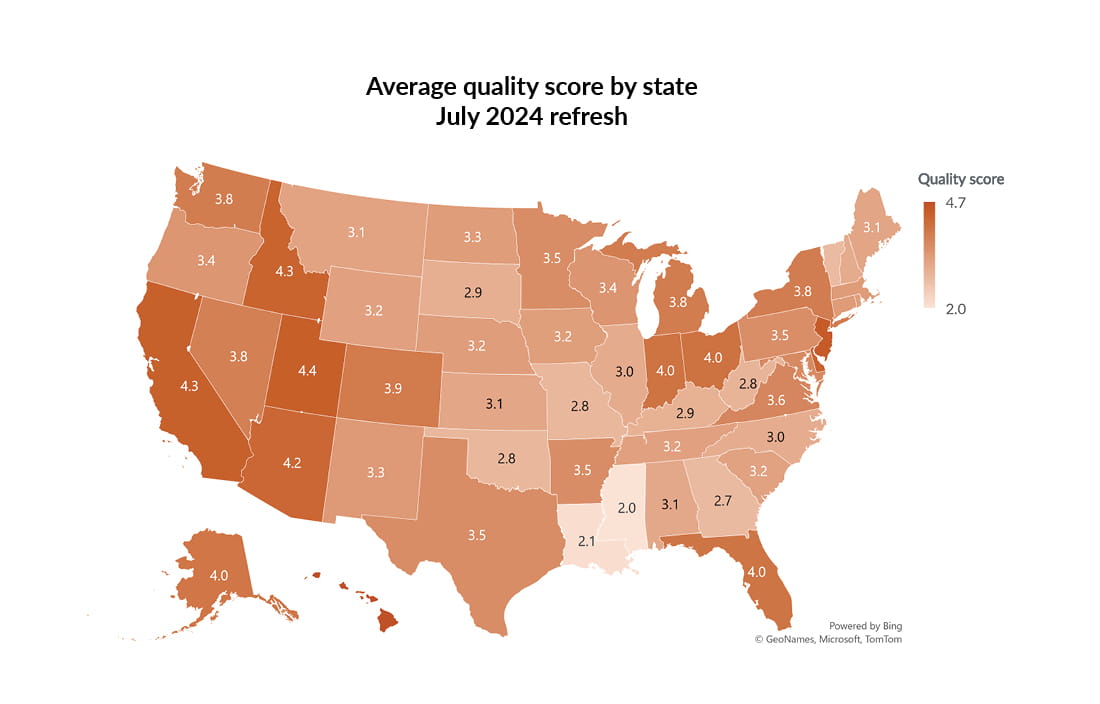
The state-average Five-Star quality score by state varies from 2.0 to 4.7 across the nation.
States that incorporate quality (VBP) as a component of their Medicaid reimbursement systems have higher quality star ratings.

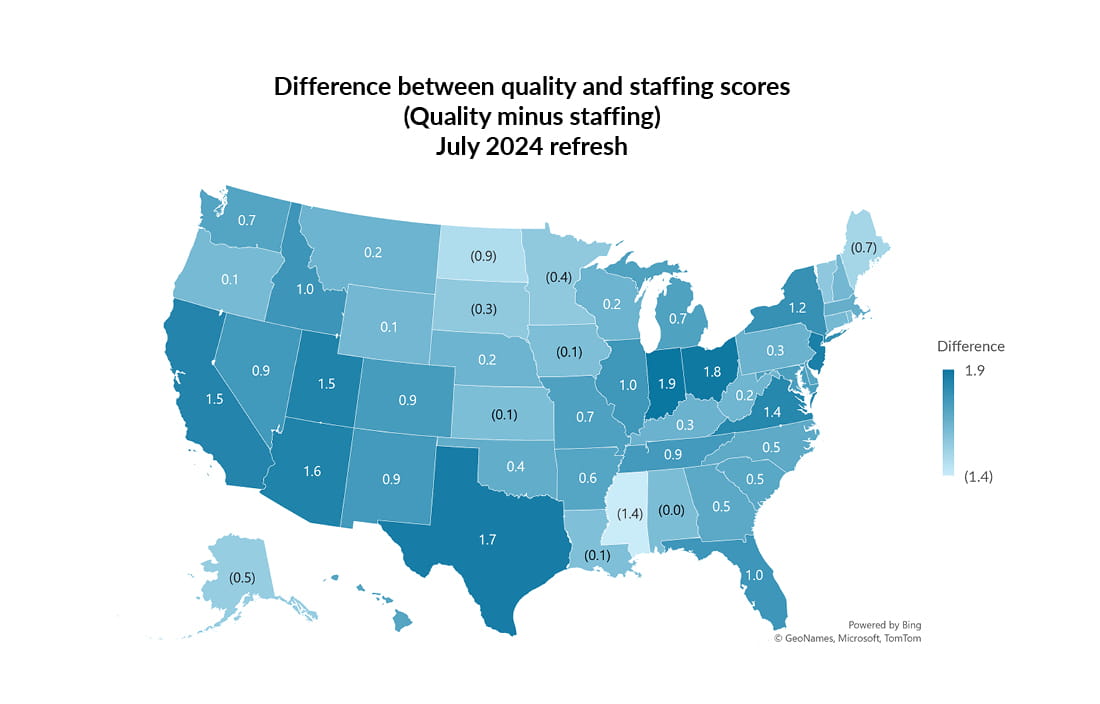
What’s the correlation between Five-Star Quality and staffing scores?
The state-average difference between the quality score and the staffing score ranges from 1.9 to (1.4) across the nation. For example, Ohio’s state-average quality score is 4.0 compared to its state-average staffing score of 2.2. Conversely, Mississippi’s state average quality score is 2.0 compared to its state average staffing score of 3.4.
We analyzed the data for the 14,834 nursing homes included in the July 2024 provider information dataset comparing each provider’s overall quality score to the components of the staffing score as well as the overall staffing score.
We performed a simple linear regression to determine the R-squared statistical value of each component. We also performed the simple linear regression comparing the overall staffing score to overall quality score.
The results of the linear regression analysis R-squared values indicate that, on their own, the individual components of the Five-Star staffing measure and the overall staffing score don’t explain the variance of the overall quality measure score between nursing homes.
Specifically, the R-squared statistical value for case-mix adjusted total nurse staffing compared to the overall quality rating was 0.0008. The R-squared statistical value for overall staffing rating compared to the overall quality rating was 0.0188.
What determines the Five-Star quality score?
The Five-Star overall quality measure rating calculation is based on a variety of MDS and claims-based measures using historical data from four quarters, or a full year (or two years) of data rather than being broken out separately by quarter. The computation for the overall quality measure is complex with procedures for missing data and imputation, scoring rules, and scoring exceptions. The full breakdown of the calculation is included in the Five-Star Quality Rating System: Technical User’s Guide July 2024.
Factors that contribute to nursing home quality and Five-Star quality score
While adequate staffing is a foundational part of a nursing home’s ability to care for residents, it’s important to consider other factors that are contributing to nursing home quality, especially through the lens of the Five-Star quality program. Nursing home quality can be impacted by state Medicaid systems policies for funding and reimbursement. For example, the Ohio Medicaid reimbursement system has a quality component that includes seven long-stay MDS measures that are used in the CMS Five-Star program. The Ohio state-average staffing score is 2.2 compared to the national average of 2.68, whereas the state-average quality score is 4.0 compared to the national average of 3.5. Many other states use quality measures and performance indicators to adjust Medicaid payments to nursing homes, which puts an emphasis on specific quality outcomes.
Staff training and care practices, access to preventative care and vaccines, and proper funding from the states and private Medicare Advantage plans are all keys to nursing home quality. Ensuring that nursing homes are properly reimbursed is a critical factor in maintaining high standards of care, meeting the needs of residents, and retaining nursing staff. Nursing homes experience a significant variation in resident acuity based on their populations and geographic locations. It’s essential to not oversimplify quality determinants based solely on staffing hours.
CMS Final Rule: Minimum staffing standards for long-term care facilities
In May 2024, CMS published their final rule on minimum staffing standards for long-term care facilities, including nationwide staffing requirements to be implemented in two phases with varying timelines based on geographic location. The requirements are shown below by phase.
Phase 1: Required May 10, 2026, for urban providers; May 10, 2027, for rural providers
- Total nurse staff HPRD: 3.48
- RN required to be on-site 24/7
Phase 2: Required May 10, 2027, for urban providers; May 10, 2029, for rural providers
- Minimum RN HPRD: 0.55
- Minimum CNA HPRD: 2.45
Response to CMS Minimum Staffing Rule
American Health Care Association and National Centre for Assisted Living (AHCA/NCAL) and other provider associations and advocates have used data and other resources to fight against the CMS Minimum Staffing Rule. According to the AHCA NCAL analysis, only 6% of nursing homes would meet all four requirements. The analysis indicates that 80% of nursing homes would need to hire more RNs to meet the requirements, specifies the number of additional nurses and nurse aides needed to be hired to be compliant with the mandate, and the cost to hire these caregivers. Importantly, AHCA NCAL found a strong correlation between Medicaid census and compliance and identified that nearly one in four nursing home residents may be at risk for displacement due to this mandate. The AHCA NCAL analysis allows for a filter to view the impact by state for each analysis.
On June 18, 2024, a lawsuit was filed in the U.S. District Court for the Northern District of Texas Amarillo Division by AHCA and several other plaintiffs against the U.S. Department of Health and Human Services and Centers for Medicare & Medicaid Services.
How you can respond to minimize negative margin impact
To stay profitable amid the updated Five-Star staffing metrics and CMS Minimum Staffing Rule, skilled nursing facilities should consider the following:
- Optimize staffing. Analyze workforce efficiency and implement flexible scheduling to minimize overtime costs while ensuring compliance with staffing mandates.
- Invest in retention. Enhance staff satisfaction through training, career development, and incentives to reduce turnover and recruitment expenses.
- Diversify revenue streams. Explore ISNP partnerships and work to negotiate better managed care rates when possible to offset Medicaid shortfalls.
- Streamline operations. Conduct operational assessments to identify savings in direct care, dietary, housekeeping, laundry, as well as administrative processes.
- Advocate for reimbursement. Collaborate with associations to lobby for adjustments to Medicaid rates, reflecting the increased costs of compliance.
- Prioritize quality metrics. Focus on care practices that improve both quality and staffing scores, strengthening reputation and eligibility for incentive programs.
- Evaluate your revenue cycle process. Margins are razor-thin, and collecting every dollar is critical to the financial success of an organization. Often revenue cycle isn’t a priority until there’s a major cash flow issue.
If you have questions regarding the direct impact on your organization, please submit a contact us form today, and a reimbursement specialist will follow up with you soon.