
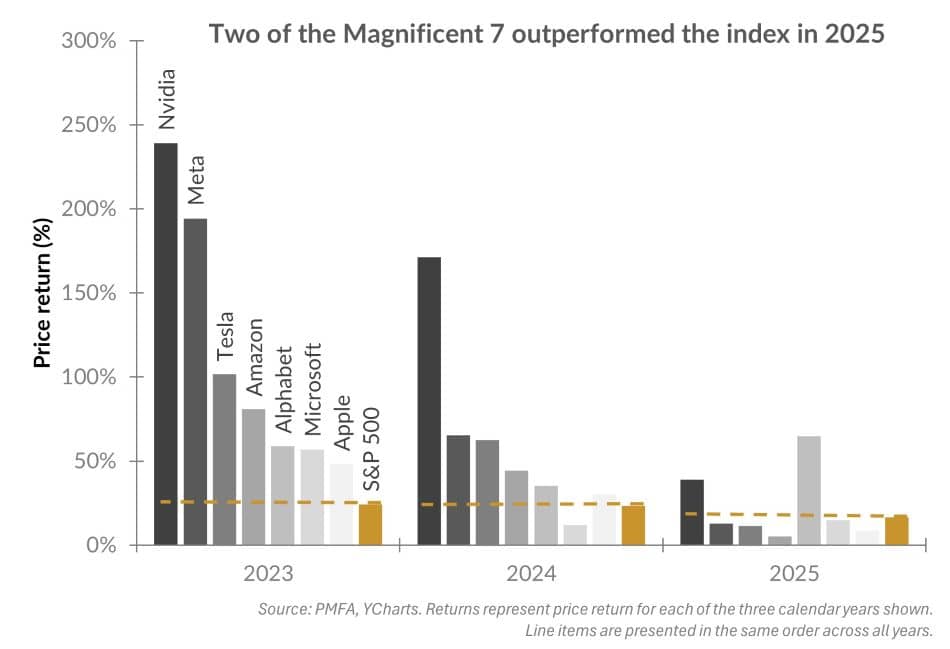
U.S. equity market leadership broadened in 2025 — a welcome shift after several years of returns being heavily concentrated in a small group of mega cap technology and AI related stocks. The “Magnificent 7” still contributed positively to overall market performance last year, but leadership within the space became more selective as other market sectors contributed to a greater degree. In fact, only two of the seven outperformed the S&P 500 in 2025, a notable change from 2023–2024, when most of the group consistently beat the benchmark.
This change highlights a more discerning market environment. Performance among the Magnificent 7 varied widely as investors focused more on fundamentals such as earnings growth, margin durability, capital intensity, and valuations. In earlier years, simply having exposure to the AI theme was often enough to drive outperformance — but that dynamic faded in 2025. The widening gap in mega cap returns suggests that fundamentals increasingly mattered more to investors than merely the AI narrative.
At the same time, market participation broadened. A wider range of sectors and companies contributed to overall returns, reducing reliance on a narrow set of high-performing stocks. Historically, periods of improving market breadth have supported more durable advances. Even so, concentration risk at the top of the index remains a factor.
The information technology sector offers a good example of this transition. The sector returned roughly 24% in 2025, outperforming the S&P 500’s approximate 18% gain, but did so despite valuation multiples contracting. This indicates that the sector’s performance was driven largely by earnings growth rather than multiple expansion — pointing toward higher quality leadership and more normalized expectations.
Overall, 2025 suggested progress toward a more balanced and fundamentally grounded market, potentially supporting a more sustainable backdrop for equity investors.
Past performance does not guarantee future results. All investments include risk and have the potential for loss as well as gain.
Data sources for peer group comparisons, returns, and standard statistical data are provided by the sources referenced and are based on data obtained from recognized statistical services or other sources believed to be reliable. However, some or all of the information has not been verified prior to the analysis, and we do not make any representations as to its accuracy or completeness. Any analysis nonfactual in nature constitutes only current opinions, which are subject to change. Benchmarks or indices are included for information purposes only to reflect the current market environment; no index is a directly tradable investment. There may be instances when consultant opinions regarding any fundamental or quantitative analysis may not agree.
Plante Moran Financial Advisors (PMFA) publishes this update to convey general information about market conditions and not for the purpose of providing investment advice. Investment in any of the companies or sectors mentioned herein may not be appropriate for you. You should consult a representative from PMFA for investment advice regarding your own situation.
© 2025 YCharts, Inc. All rights reserved, The information contained herein: (1) is proprietary to YCharts, Inc. and/or its content providers; (2) may not be copied, reproduced, retransmitted, or distributed; and (3) is provided “AS IS” with all faults and is not warranted to be accurate, complete, or timely. YCHARTS, INC. AND ITS CONTENT PROVIDERS EXPRESSLY DISCLAIM, TO THE FULLEST EXTENT PERMITTED BY APPLICABLE LAW, ANY WARRANTY OF ANY KIND, WHETHER EXPRESS OR IMPLIED, INCLUDING WARRANTIES OF MERCHANTABILITY, FITNESS FOR A PARTICULAR PURPOSE, ACCURACY OF INFORMATIONAL CONTENT, OR ANY IMPLIED WARRANTIES ARISING OUT OF COURSE OF DEALING OR COURSE OF PERFORMANCE. Neither YCharts, Inc. nor its content providers are responsible for any damages or losses arising from any use of this information. Past performance is no guarantee of future results.


